It has been more than 15 years since cash yields last reached 5%, and these higher rates have many investors wondering whether it’s time to seek the security of cash.
While this may feel safe, there are many reasons to avoid crowning cash king.
Cash Can Be a False King
In the short term, earning 5% in savings accounts, money market funds, CDs, and T-Bills can feel good since you can also avoid the roller coaster ride of stock market volatility.
But a settled stomach can quickly turn sour when you consider keeping too much in cash can leave money on the table.
Consider a $50,000 investment made thirty years ago in one-month US Treasury bills, continually reinvested. That $50,000 would today be worth $95,000.
The same sum invested in a balanced portfolio of stocks and bonds (S&P 500 and Bloomberg US Aggregate Bond Index) would have grown to more than $450,000 over that time.
That’s over $350,000 of lost opportunity—a high price to have paid for temporary peace of mind.
What Cash Giveth, Inflation Can Taketh Away
While foregone wealth is one drawback to holding cash, there’s also the significant risk of lost purchasing power.
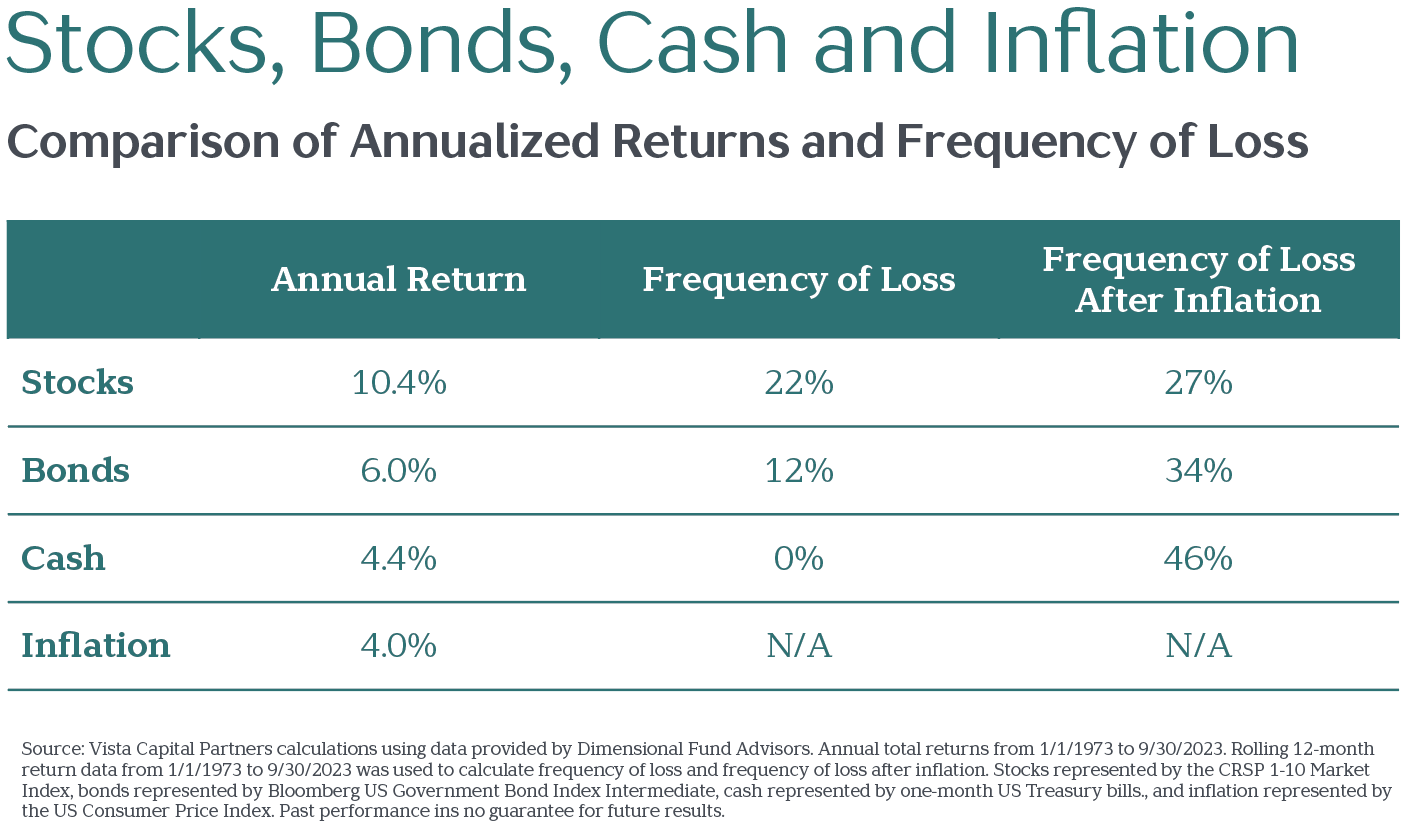
Since the mid-1990’s, the return on cash has been lower than the rate of inflation in 46% of all rolling 12-month periods. This has meant the “real return” after inflation has been negative nearly half the time.
While that isn’t always felt in the short run, it can be devastating over the long run. Remember our example of the $50,000 investment in T-bills, which grew to $95,000 over thirty years? Adjusted for inflation, that $50,000 would purchase just $46,000 of goods and services today.
The table below highlights the historical annualized returns of stocks, bonds, cash, and inflation. While stocks have been the “riskiest” on an annual basis, cash has more frequently delivered a negative 12-month return, after accounting for inflation. This may come as a surprise to many investors.
High Interest Rates Don’t Signal Stock Market Losses
Some fear today’s high short-term interest rates (aka cash yields) imply low future stock returns, thus increasing the attractiveness of cash.
This fear has theoretical justification in how asset prices are determined. At its simplest, the price of an asset today is the discounted sum of its future cash flows, profits, or dividends.
As the graphic below shows, however, there is little correlation between historical yields on US Treasury securities and subsequent calendar year stock returns.
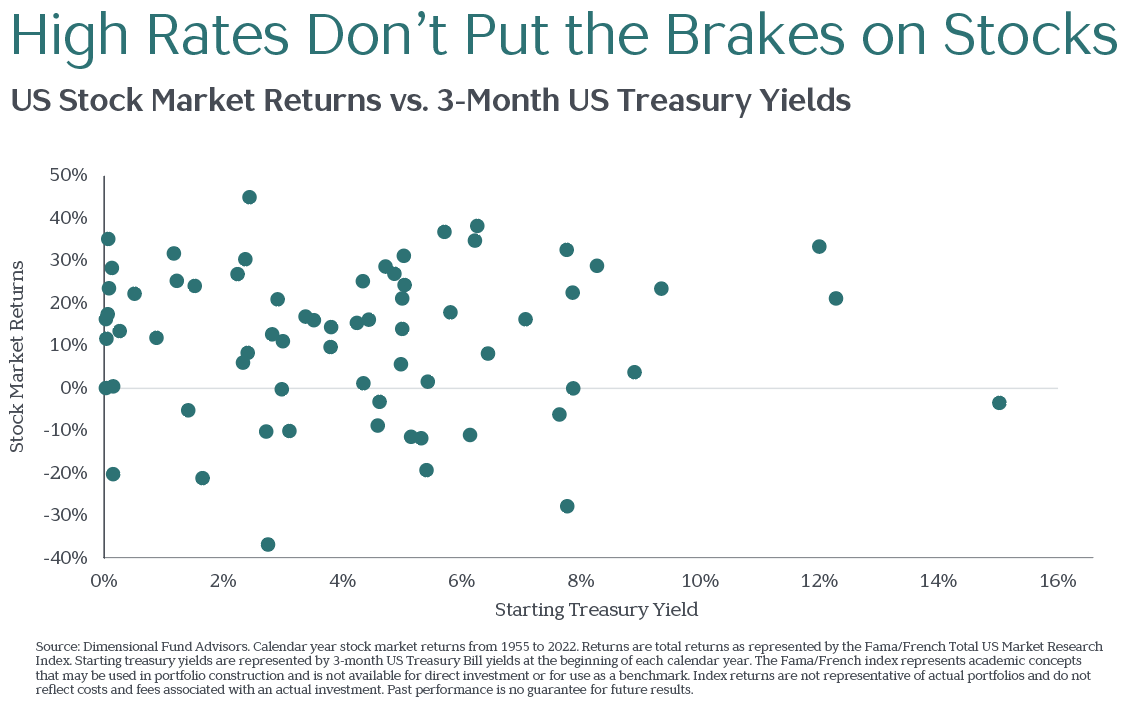
If the level of interest rates did influence subsequent stock returns, we’d see a clear pattern in the data presented above.
Instead, we see a random scattering of dots—indicating there is no clear relationship between starting interest rates and subsequent stock returns.
Clearly, today’s level of interest rates is far from the only factor influencing stock returns.
Consider the Journey, Not the Moment
While holding cash may feel reassuring in the short term, cash is not king in the long run.
Cash is more likely than stocks and bonds to lose purchasing power over time, increasing the risk of falling short of long-term goals, such as retirement spending or leaving assets to heirs or charity.
While holding cash for an upcoming purchase or tax bill makes sense, a diversified stock and bond portfolio has historically been the best way to protect and grow your nest egg.
——-
1 Vista calculations using CRSP, Morningstar, and Bureau of Labor Statistics data. Frequency of outperformance compared to CPI from 1/1/1973 to 9/30/2023. Total returns for US stocks, as measured by the CRSP 1-10 Market Index, and cash, represented by 1-Month US Treasury Bills, vs. the US Consumer Price Index.
