
In a recent Wall Street Journal op-ed, neurologist and investment advisor William Bernstein, MD, PhD, reminisced about the last 2008–2009 bear market, when he longed to hold onto his bond allocations “as tightly as a toddler clutches a teddy bear during a thunderstorm.”
To his credit, my friend Bill also explained why he knew better than to succumb to his fears. He concluded: “Losses come with the [stock market] territory, and even the Almighty himself wouldn’t be able to time the market deftly enough to enjoy the gains without the pain.”
The point is, even brain doctors are human. We’re all susceptible to doubt and despair in down markets. But if we want to build durable wealth across varied market conditions, we must let go of false comforts. The ideal is to instead bravely rebalance your global stock portfolio back on target toward its long-range goals.
Let’s dampen some of the dread of doing that by exploring the link between today’s market prices and future expected returns.
Prices Paid vs. Returns Earned
Every investor wants to buy low and sell high. But what’s “low”? Are today’s stock prices bargain buys, or pricey propositions? And what, if anything, do they tell us about future returns?
One way to assess a stock’s prospects is to look at its price-to-book (p/b) ratio. This tells us whether a company’s stock price seems expensive or cheap relative to its book value (net assets, or assets minus liabilities).
In aggregate, stock asset classes with high current p/b ratios have historically exhibited lower future returns. Those with low current price-to-book ratios have exhibited higher future returns.
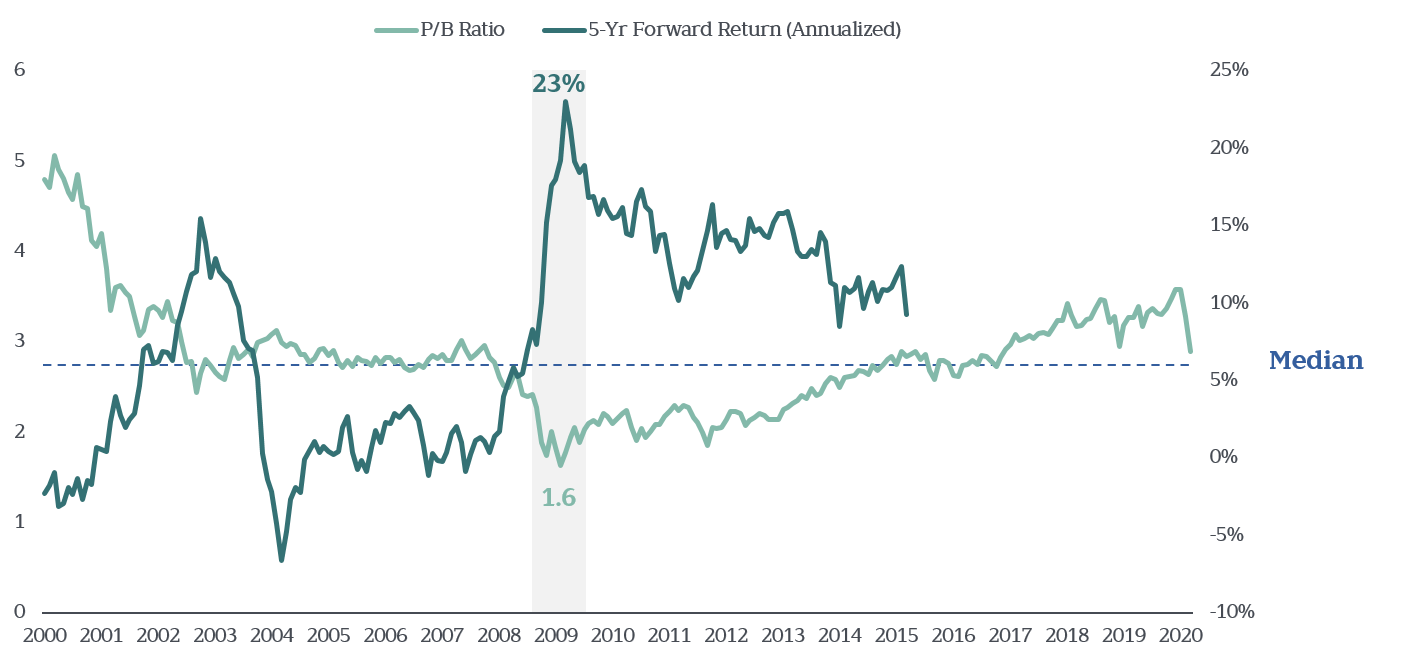
We can see this relationship in action in Exhibit 1, which plots the next 5-year annualized returns at any point in time during the past 20 years. For example, in February 2009, when the S&P 500 index’s p/b ratio stood at 1.6, the asset class went on to deliver an eye-popping 23% annualized return over the next five years.
Exhibit 1: S&P 500 Index P/B Ratio vs. Return
January 2000—March 2020

“Cheap” Is Relative (and Not a Market-Timing Tool)
So, when a stock asset class is “cheap,” its future tends to look brighter. But be forewarned. Patience is a virtue here, as it can take a very long time for the relationship between prices and expected returns to play out. Stocks can remain relatively “cheap” or “expensive” for years … and then turn on a dime. This can leave investors who are subject to recency bias confused about just where they stand in a forest filled with trees.
For example, U.S. large-company stocks may currently appear to be low-priced. But the asset class is not really such a big bargain. In late March, even after its steep decline, the p/b ratio of the S&P 500 stood at 2.9, just above its median 2.8 from the past 20 years.
A World of Returns
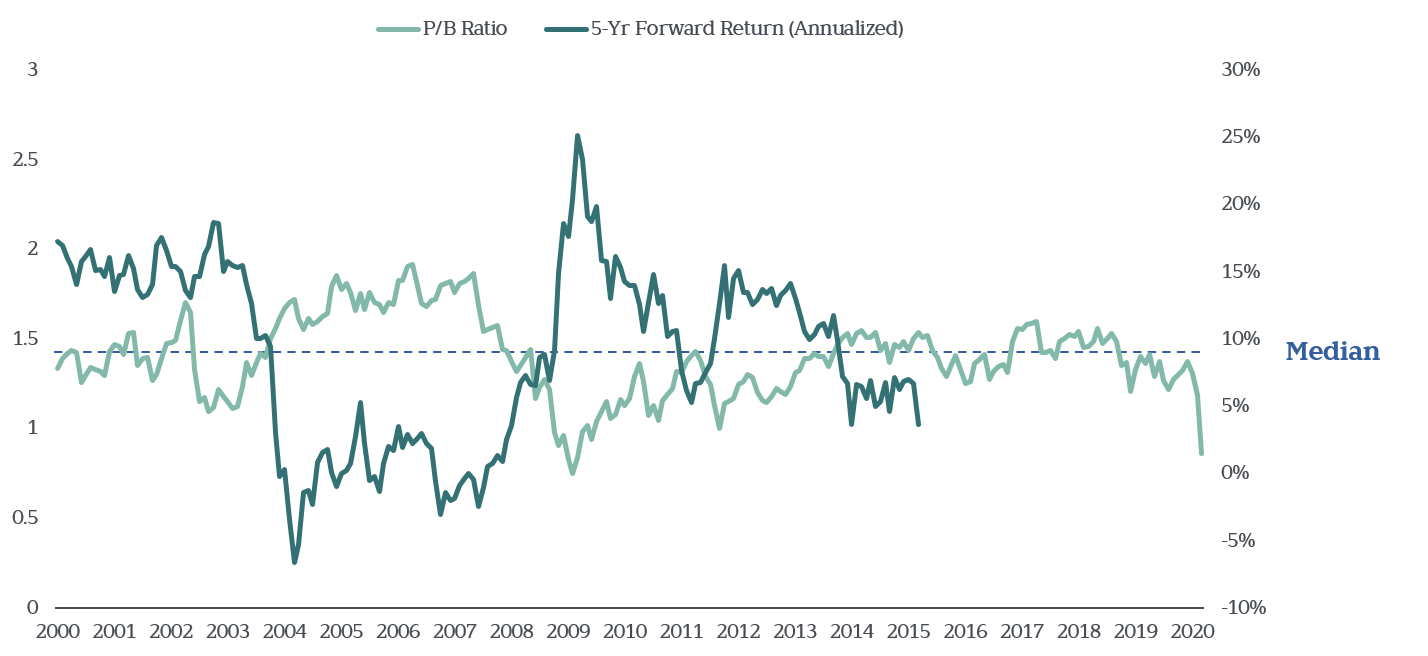
While the S&P 500 may not be underpriced, we also know that U.S. large-cap stocks aren’t the only investments around. Using the same gauge, there are plenty of other asset classes with historically low p/b ratios. For example, the p/b ratio for U.S. small-cap value stocks is currently much lower than its 20-year historical median of 1.4. In fact, at 0.86, it’s nearly at its low levels of 2009, when subsequent returns were so attractive.
Exhibit 2: Small-Cap Value P/B Ratio vs. Return
January 2000—March 2020
Consider this spectrum of other global asset classes. All of them except the S&P 500 are exhibiting attractive (lower current) valuations compared with their median p/b ratios:
Exhibit 3: Price-to-Book (P/B) Pricing Comparisons*
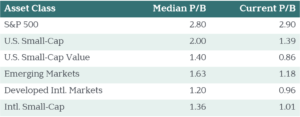
*Median p/b is over last 20 years, through March 20, 2020. Current p/b is as of March 20, 2020.
The Future Looks Brighter in the Shade
Again, low current p/b ratios set the expectation for higher future returns. So, not surprisingly, the asset classes with the most promising future expected returns are the same ones that recently took the worst beating.
The take-away? While it may feel scary to rebalance your portfolio out of the “teddy bear” asset classes and into the current grizzlies, doing so is a critical aspect of any disciplined, long-term investment plan.
To expect lasting portfolio gains, you must at least look past the current pain, if not give it a giant bear hug. The strong market surges of the past few weeks should remind us that—even in the gloomiest of climates—we can catch glimpses of brighter days ahead. Rebalancing helps investors capture those rays when they do shine through.
Chart Sources
Exhibit 1: S&P 500 Index; YCharts.
Exhibit 2: Russell 2000 Value Index; YCharts.
Exhibit 3: S&P 500 Index; Russell 2000 Index; Russell 2000 Value Index; MSCI EM Index (net dividends); MSCI EAFE Value Index (net dividends); MSCI ACWI ex-USA Small Cap Index (net dividends); YCharts.