As humans, we’re drawn to the familiar—we follow the same routines, take the same routes, and frequent the same places. This natural inclination to stick with what we know extends to our investment choices, resulting in a phenomenon known as “home bias.”
What is Home Bias and Why Does it Exist?
“Home bias” is the tendency of investors to favor the stocks of companies based in their home country, even when similar or more attractive opportunities may exist beyond their borders.
Consider the automotive industry: Ford and General Motors are household names for American investors, while international giants like Toyota or Volkswagen may receive less attention despite their global scale and history of innovation.
In the U.S., several factors may contribute to investors’ home bias:
- Familiarity and comfort: Investors may feel more confident investing in companies and industries they understand, and which enjoy more widespread media coverage.
- Perceived risks: Concerns about political instability, currency issues, or other economic uncertainty abroad can deter investors from diversifying internationally.
- Barriers: Certain foreign markets have less developed exchanges and U.S. investors can face higher transaction costs and tax implications when investing internationally.
It’s also natural to want to participate in local successes; it’s why we sometimes jump on the bandwagon when our sports teams win in the post-season. When the home country’s market performs well, investors may regret allocating their money internationally.
Home Bias is a Global Phenomenon
While Americans tend to root more for the home team than do citizens of other countries, they’re not alone. Most investors around the world fall prey to home bias. A 2021 study by Martin Wallmeier and Christoph Iseli revealed that:
- U.S. investors allocate nearly 82% of their stock holdings to domestic companies, the highest share among developed nations
- Japanese investors follow close behind, with 81% of their stock portfolios held in Japanese companies. Japan comprises just 7% of the world’s total stock market capitalization.
- Investors in Norway and the Netherlands have the lowest levels of home bias, with domestic investments making up just 18% and 33%, respectively, of their stock holdings.
- Investors in India, Egypt, and the Philippines allocate close to 100% of their stock portfolios to companies based in their respective local markets, despite those countries’ tiny share of aggregate global market capitalization.
The Risks of Home Bias
Allocating an outsized portion of a portfolio to one’s domestic market can have an impact on a portfolio’s expected return and risk.
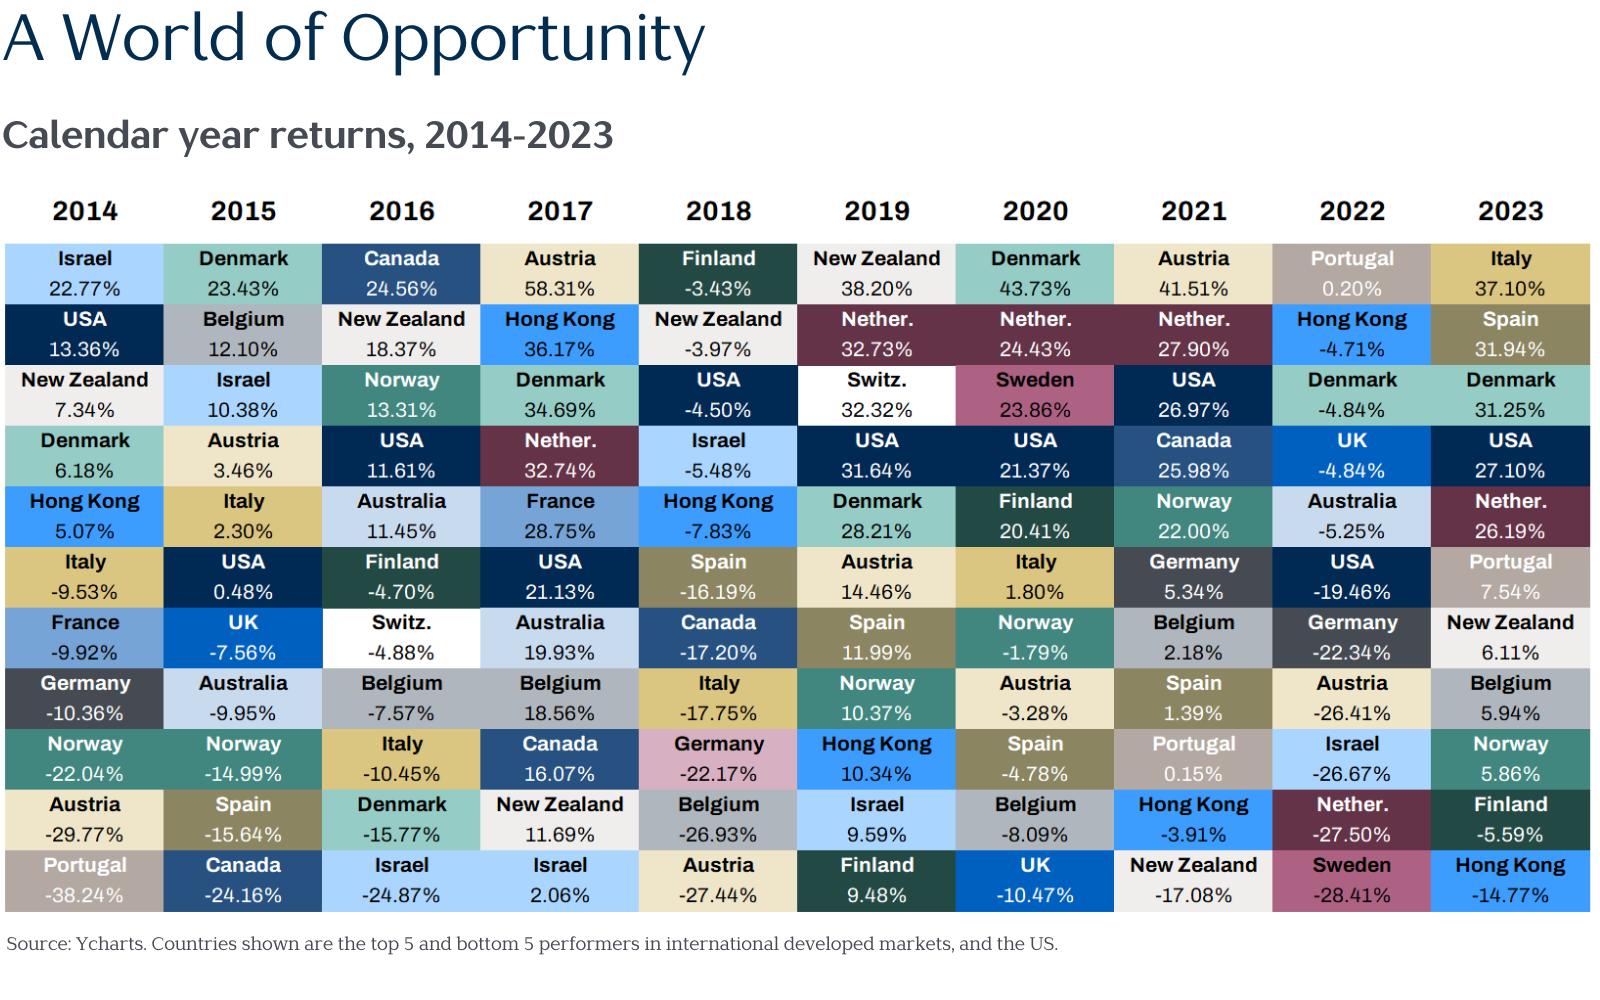
The chart below shows performance for the top 5 and bottom 5 countries, ranked by calendar year returns, in international developed markets from 2014-2023. For comparison, we’ve also included the United States among these best and worst performers.
Interestingly, the average return of the worst performing countries over this period was -17.4%, while the average return of the best performers was 28.6%; a difference of 46% per year. Clearly, the benefits of picking “the best” and avoiding “the worst” have been significant.

But distinguishing the best from the worst is only clear with the benefit of hindsight.
Who would have guessed that Austria, the top performing market in 2017, would have been the worst just a year later? Or Finland, the best performer in 2018, being the worst performing developed market in 2019?
The chart above clearly shows how well the U.S. stock market has performed over the past decade. While never “the best,” in eight of the past ten years, the U.S. has been among the top 5 performers. This is also why valuations for U.S. stocks are near their highest levels since the early 2000’s.
This contrasts sharply with the global stock performance in the ten years from 2004 to 2013 (not shown), when the U.S. was among the top 5 performing countries just four times—and among the worst performing countries five times! These years coincided with the “lost decade” for U.S. stocks—the stretch from 2000 to 2009 during which $1 invested in the S&P 500 turned into just 91 cents.
Overcoming Home Bias
These period-to-period fluctuations and changes in country leadership highlight the risks of attempting to pick next year’s winner and of home bias in general. While loading up on domestic investments might feel familiar and comfortable—particularly after a period of stellar recent performance—doing so can leave portfolios vulnerable to the volatility of a single economy.
Home bias may be a global phenomenon, but the solution is also universal. Diversifying internationally can help protect investors in times when their home country’s stock market disappoints.
A typical Vista portfolio owns over 15,000 stocks across 46 global economies. By expanding the opportunity set beyond U.S. stocks, we increase our expectation of harnessing returns where they materialize, while reducing the risks inherent to investing solely in one’s home country.
