
In the financial landscape, alternative investments such as private credit, private equity, venture capital, and hedge funds have garnered media attention as institutional investors intensify their commitments to non-traditional assets.
State and local pension plans, for example, manage the retirement savings for more than 20 million government employees. These plans have substantially raised their collective allocations to alternatives—from less than 10% in 2001 to more than 30% by the end of 2022. Much of this increase came following the Global Financial Crisis of 2008, when many plan trustees were left disappointed by the performance of publicly traded stocks.
Today, public pensions in the U.S. hold a record $1.6 trillion in alternative assets, constituting one-third of total plan assets.
While alternative investments have grown in institutional popularity, do they deserve a role in an individual investor’s portfolio?
Evidence From Public Pension Plans
Although alternative investments’ allure lies in their potential for higher returns, recent results suggest they’ve failed to live up to the hype.
A recent study by Boston College[i] revealed that public pension plans delivered an annualized average return of 5.9% from 2001 to 2022. This is slightly lower (although not statistically so) than the 6.0% annualized return of a traditional balanced portfolio comprised of 60% S&P 500 Index and 40% Bloomberg US Aggregate Bond Index.
A more globally-diversified portfolio—like those constructed by Vista—including small cap and value stocks, as well as publicly-traded real estate (REITs), returned 6.9% per year, over the same period[ii].
Evidence From University Endowments
As some of the country’s largest pools of investment capital, college and university endowments also provide a lens into how the so-called “smart money” invests.
Like public pension plans, endowment funds also tend to be heavy users of alternative investments. At the end of June 2023, the average U.S. endowment fund held roughly 45% of its portfolio in alternatives, such as private equity and venture capital, and less than 13% in publicly traded U.S. stocks.[iii]
Harvard University, for example, boasts the largest university endowment in America. Harvard’s endowment is valued at more than $50 billion, yet just 11% is allocated to public stocks and a mere 6% to traditional bonds.[iv]
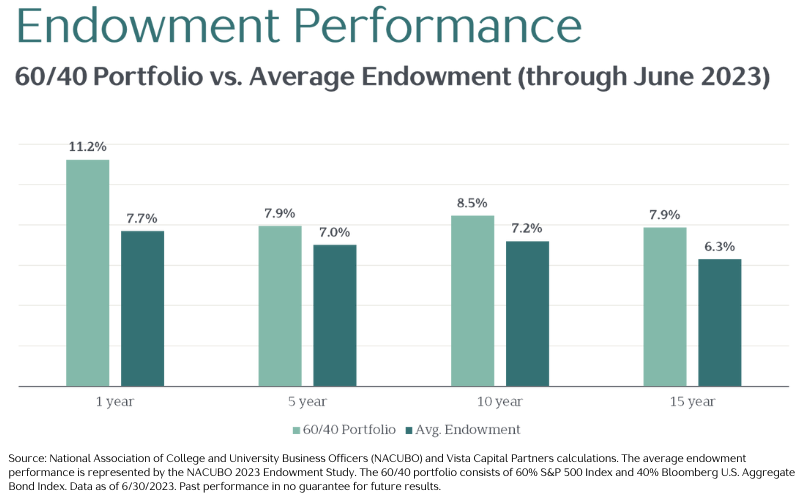
Each year, the National Association of College and University Business Officers (NACUBO) comprehensively reviews the performance of the nation’s endowment funds. And it seems the additional complexity of these endowment portfolios has not rewarded university coffers.
For the most recent fiscal year ended June 2023, the average endowment returned 7.7% (Harvard returned just 2.9%). This compares unfavorably to the 11.2% return of the traditional 60/40 portfolio.
Performance over longer periods is shown below:
What About the Diversification Benefits?
While we’ve focused thus far on performance, proponents of alternatives often point to the reduced volatility of portfolios holding significant amounts of private assets. The thinking goes, private and alternative assets are less correlated to public markets, as their returns may “zig” when those of public stocks and bonds “zag.”
It’s important to remember, however, private assets are typically valued less frequently, generally monthly or quarterly, whereas public stocks and bonds are priced throughout each trading day. Infrequent, or “lagged,” pricing can create the impression an alternative asset is less correlated and less risky than its public counterpart, when it may not be.
To illustrate, consider the return volatility of the S&P 500 Index. Below, we’ve highlighted its returns measured three distinct ways—on a monthly, one-year average, and three-year average basis.
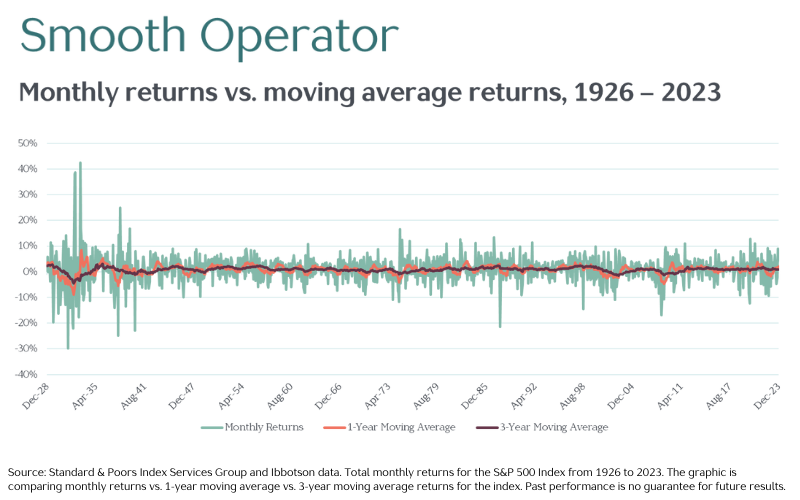
Since 1926, the S&P 500 Index has returned an annualized average of 10.3% (not shown). We’d all agree the market’s long-term historical performance has been the same, whether measured on a monthly, annual, or average three-year basis.
As graphic above clearly illustrates, however, less frequent or smoothed pricing results in the same asset appearing “less risky.” Promoters of private assets, of course, can use this as a selling point, when in fact it’s a mirage—the underlying risk of the S&P 500 Index is the same regardless of how frequently it is priced.
Why the Popularity?
As some of the largest, most sophisticated pools of capital in the country, endowments and pension plans are often looked to as the “smart money.” Individual investors tend to follow their lead, perhaps believing greater personal wealth requires more complexity or deserves access to more exclusive investments.
The real reason behind the growing prevalence of alternative and private assets in individual portfolios, however, may boil down to one word: fees.
Because alternatives and privates carry higher management fees—consider the typical 2% management fee and 20% of profits arrangement (“two and twenty” in industry parlance) levied by many hedge funds—they represent a more profitable source of revenue for brokers and advisors pushing them.
And selling these pricier alternatives is a key part of major Wall Street brokerage firms’ growth strategy.[v]
It is no surprise, then, that alternatives have infiltrated the portfolios of investors who seem all too willing to embrace their hyped benefits.
The Hogwarts Effect
Because cost and expected return are related, the increased use of pricy alternative and private assets is discouraging news for investors.
Richard Ennis, a pioneering consultant to large institutional portfolios, pulls no punches when discussing today’s institutional fund management. He estimates the higher use of alternative investments in U.S. pension and endowment portfolios costs beneficiaries at least $100 billion a year.
“People managing institutional assets,” he concludes, “behave not like they attended the Booth, Säid, or Wharton schools to study finance but Hogwarts School of Witchcraft and Wizardry.”[vi]
Rather than construct portfolios based on hype or hope, we favor data and evidence. And the evidence is clear: complex and expensive alternative investments aren’t necessary to deliver a successful investment experience.
—————
[i]Jean-Pierre Aubry. “Public Pension Investment Update: Have Alternatives Helped or Hurt?” Center for Retirement Research at Boston College paper. November 2022. IB_22-20.pdf (bc.edu)
[ii] Globally diversified portfolio is a hypothetical construction from January 2001 through December 2022 and is intended to be a reference tool rather than an attempt to predict future performance. Past performance is no guarantee of future results. Stocks are represented by 30% CRSP Deciles 1-10 Index, 30% Dimensional US Adjusted Market Value Index, 15% Dimensional International Adjusted Market Index, 6% Dimensional International Small Cap Index, 6% Dimensional Emerging Markets Adjusted Market Index, 3% Dimensional Emerging Markets Small Index, 7% Dow Jones US Select REIT Index, and 3% S&P Global ex US REIT Index (net dividends.). Bonds are represented by 40% Bloomberg US Treasury Bond Index Intermediate, 30% FTSE Non-USD World Government Bond Index, and 30% Bloomberg US TIPS Index.
[iii] https://www.nacubo.org/Press-Releases/2024/US-Higher-Education-Endowments-Report-7-7-Return-for-FY23-While-Spending-More
[iv] https://finance.harvard.edu/files/fad/files/fy23_hmc_letter.pdf
[v] https://www.investmentnews.com/wirehouses/features/morgan-stanley-wealth-unit-unveils-plan-to-hit-growth-target-250590)
[vi] Richard Ennis. “Hogwarts Finance.” Social Science Research Network (SSRN) paper. October 26, 2023. Hogwarts Finance by Richard Ennis :: SSRN