
Does an inverted yield curve foretell economic disruption or signal that a recession is around the corner? If so, should we lighten our exposure to stocks?
Many financial market observers began asking these questions after the Treasury yield curve briefly inverted on April 1, 2022. With stock and bond markets each down more than 10% for the year, the chorus of media voices has only grown louder.
For the record, our crystal ball is as cloudy as yours. We do think, however, that defining a few terms and reviewing the historical record may be the best way to frame investors’ expectations for the future.
So, first things first. What is a yield curve? And why does an inverted one make investors nervous?
The Long and Short of Yield Curves
A yield curve is simply a line created by plotting bond interest rates across various maturity dates. The most frequently referenced yield curve is that of U.S. Treasury bonds, which provides a daily snapshot of the rate earned by loaning the government money for time periods ranging from one month to 30 years.
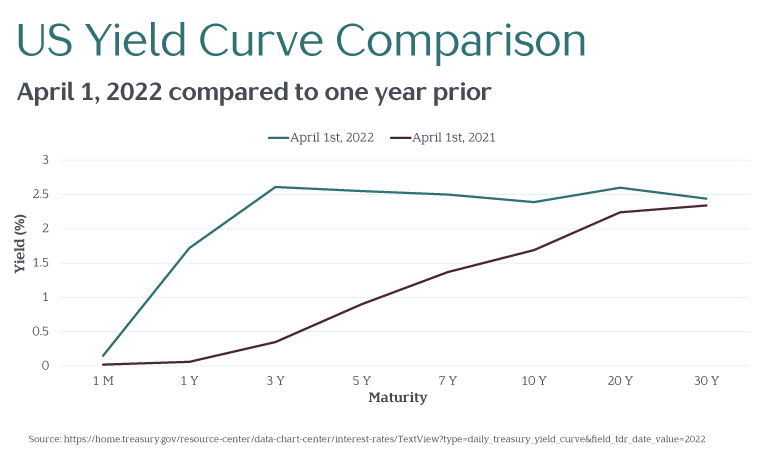
The plotted line is typically upward-sloping because investors usually demand extra compensation for the additional risk of making a longer-term loan.
Every so often, however, short-term yields approach, or even exceed, long-term yields. When this happens, the curve is said to be “inverted.”
Yield Spreads
An easy way to monitor changes in the yield curve is by looking at yield “spreads.” A yield spread is simply the difference between a longer- and shorter-term yield.
As an example, the “10-2 spread” is the difference between 10-year and 2-year Treasury bond yields. While there are many other spreads (for example, 10-year minus 1-year, 5-1, 5-2, 30-1, etc.), the 10-2 yield spread is oft cited and followed.
And the 10-2 yield spread is the one that turned negative in early April, meaning the 2-year Treasury bond briefly yielded more than a Treasury bond maturing in 10 years.
Curves, Spreads, and Recessions…Oh My!
When a yield curve inverts, and a yield spread turns negative, investors may fear (correctly or not) we’re in for a long haul of poor economic or market conditions.
Why? Indeed, each of the past six U.S. recessions has been preceded by an inverted yield curve.
But before we accept as fact an inverted yield curve or negative yield spread “causes” a recession and is a signal to get out of stocks, let’s examine the historical record.
For starters, while yield curve inversions have preceded recessions over the past 50 years, U.S. history includes other recessions where the yield curve did not invert, such as in 1957–1958 and 1960–1961. We also witnessed a yield curve inversion in 1966, with no recession shortly following.
We should remember, too, the number of yield curve inversions and recessions is limited. While the casual observer might look at the graphic below and believe that recessions (shaded in grey) always follow inversions (highlighted in red), it is challenging from a statistical perspective to conclude so with confidence. There is often a lot more to the story.
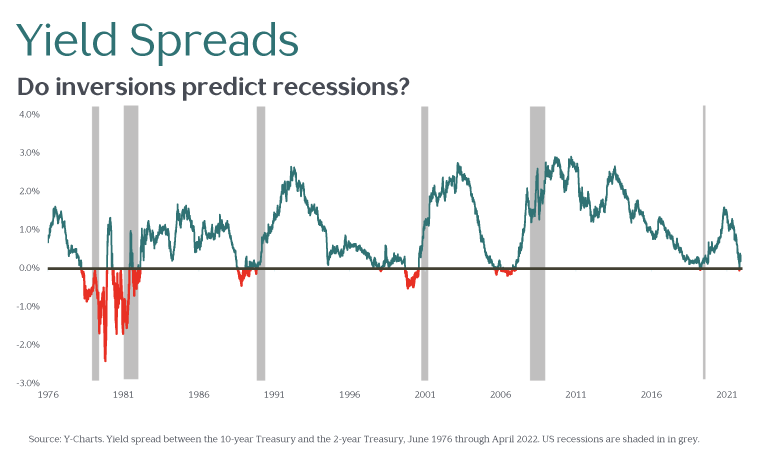
Consider the 1973–1974 recession. Yes, yield curves inverted, but the Arab oil embargo likely contributed heavily to the U.S. recession. And it’s unlikely economists or market forecasters ”predicted” the oil embargo and so can’t lay claim to predicting the subsequent recession.
Similarly, there’s far more evidence to suggest the arrival of the COVID-19 pandemic was the root cause of the early 2020 recession, and not the brief yield curve inversion that preceded it in August 2019. Did economic forecasters predict a global pandemic back in August 2019 when the yield curve inverted? Likely not.
What’s an Investor to Do?
Let’s play along and assume inverted yield curves are an indicator a recession is coming. Investors may think they’d want to avoid recessions, but they’d do well to remember markets are forward looking.
That means U.S. stocks have historically declined well in advance of economic recessions and have risen off their lows prior to a recession’s end. To be sure, timing one’s investments to coincide with the start and end of recessions has not been a profitable strategy.
What about negative yield spreads? Do they foretell stock market losses? Again, if we look at the past relationship between yield spreads and subsequent stock market returns, we don’t see a strong connection.
The diagram below plots six-month U.S. total stock market returns against historical daily 10-2 yield spreads from October 1973 to December 2021. If there was a strong relation between spreads and returns, we would see some discernable pattern and more negative returns associated with negative spreads.
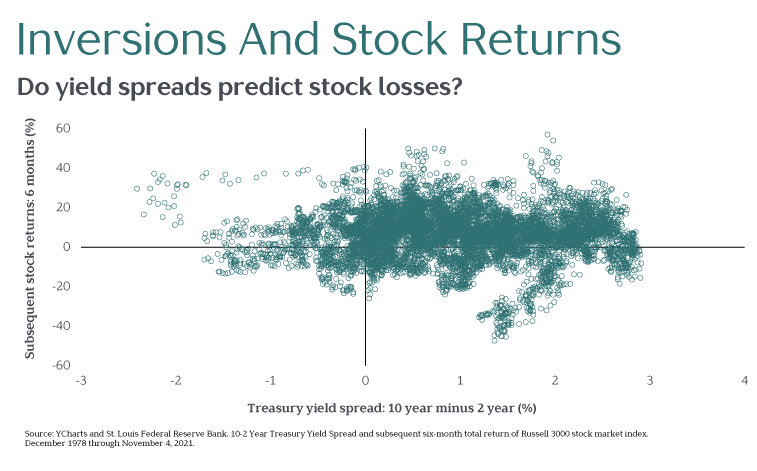
Instead, we see a wide range returns following negative spreads—ranging from nearly -25% to +40%. Whether positive or negative, daily 10-2 yield spreads appear to signal nothing but a random scattering of subsequent short-term stock returns.
The Final Word
What about other yield spread measures over longer time periods? Is there some information in other yield spreads investors can use to improve portfolio performance?
Professors Eugene Fama and Kenneth French sought to answer this very question in their paper, “Inverted Yield Curves and Expected Stock Returns.”
The two professors constructed a set of active timing strategies that added cash to stock portfolios in proportion to how often yield curves were inverted. They then tested their strategies over 40 years of data, using six different yield spreads across twelve different global stock markets.
The professors’ conclusion? Investors who shifted from stocks to cash following yield curve inversions earned lower returns than those who simply remained fully invested.
These results suggest, once again, that rather than seek to avoid the market fear du jour, it’s probably best to do nothing. Simple, but not easy.