
It’s no secret that value stocks have been laying low for awhile. These low-priced shares have underperformed growth stocks by nearly 10% per year over the past decade. Is value investing dead?
From our perspective, we’ve covered this terrain before and are as optimistic as ever for the future of value stocks:
- Value and growth stock fundamentals seem as relevant as ever.
- Valuations for growth stocks are the highest they’ve been in decades (driven, as they often are, by a handful of the largest “growthiest” stocks).
- Relative to growth, valuations for bargain-priced stocks are near their lowest in decades.
- Investors should be especially eager to retain their appropriate value stock allocation.
History, Near and Far
The extreme popularity of growth stocks today is evident in recent returns and current valuations. The most extreme spread between value and growth has shown up when comparing small-cap value to large-cap growth. Over the past 94 years (ending July 2020), small value outperformed large growth by a satisfying 4.1% annualized. Over the past 10 years, the tables have turned: Large growth has trounced small value by a hefty 10.3% annualized.
Exhibit 1: Underperformance in Perspective
Annualized Returns Ending July 2020

Year to date (YTD) in 2020, this performance gap has only widened. Through August, large growth (Russell 1000 growth) is up 30% YTD, while small value (Russell 2000 value) is down –18% YTD.
This extreme difference in performance has led to ever-widening valuations. For example, the current spread in the price-to-book ratios for large-cap growth stocks and small-cap value stocks is wider today than it was in 1999.
At that time, back at the height of the technology-fueled boom, many investors were clamoring for more tech exposure in their portfolios, seemingly unconcerned with the ballooning valuations within US growth stocks.
Not long after that, of course, the tech bubble burst, and those high-priced stocks actually lost money over the next 10-year period, from 2000 to 2009.
The Bigger They Are
That’s not to say past is prologue and today’s tech darlings are in for a fall. In fact, it’s hard to be more impressed with the successes of the FAANG stocks (Facebook, Apple, Amazon, Netflix, and Google), whose size today didn’t happen by pure chance.
But remember, for a stock to continue to outperform its peers, the company’s performance must continue to not just meet, but exceed, those expectations.
Over the 10-year period ending August 2020, the FAANG stocks collectively returned over 34% per year on an annualized basis. So, should we expect these stocks to return 34% per year for the next 10 years? No. While some might argue these companies continue to be “sure bets,” we must keep in mind that risk and return go hand in hand. You don’t get high future returns and little risk.
In a ruthless paradox, the better a company has performed and the bigger and more pricey it becomes, the harder it can be for it to deliver on the lofty expectations built into its current price.
To illustrate, we need only look to the past. Seven years ago, ExxonMobil was the largest stock in the world by market-cap. Last month, it was removed from the Dow Jones Industrial Average (Dow) index—an ignoble end to ExxonMobil’s 92-year presence on the Dow.
The intent isn’t to celebrate any company’s setbacks, nor to suggest we’ve heard the last of them yet. Rather, we want to emphasize that no stock or asset class is truly too big to disappoint the investor whose portfolio has grown overly dependent on its future growth.
The Story in the Spread
We can look at historical data to further suggest that investors should think twice (or more!) before betting on the persistence of the extraordinarily wide spread between growth and value stocks.
The following two charts compare large-cap growth and small-cap value stock valuations to their subsequent five years of performance. Valuations are measured by price-to-book ratios, using the left-hand scale and light-green lines. Rolling, 5-year annualized forward returns are displayed as dark-green lines, using the right-hand scale. (Exhibit 2 also illustrates how large growth stock valuations are at a level not seen since 1999.)
For example, if you would have purchased large-cap growth stocks on the eve of the tech bubble in 2000 (which is what most investors coveted at the time), your subsequent 5-year return would have been awful, at nearly –10% per year. Conversely, if you would have purchased small value stocks at their lowest valuations in early 2009 (which seemed equally as foolish at the time), you would have been rewarded with 25% per year annualized returns over the subsequent five years.
Exhibit 2: Large Growth P/B Ratio and 5-Year Returns
June 1992—June 2020
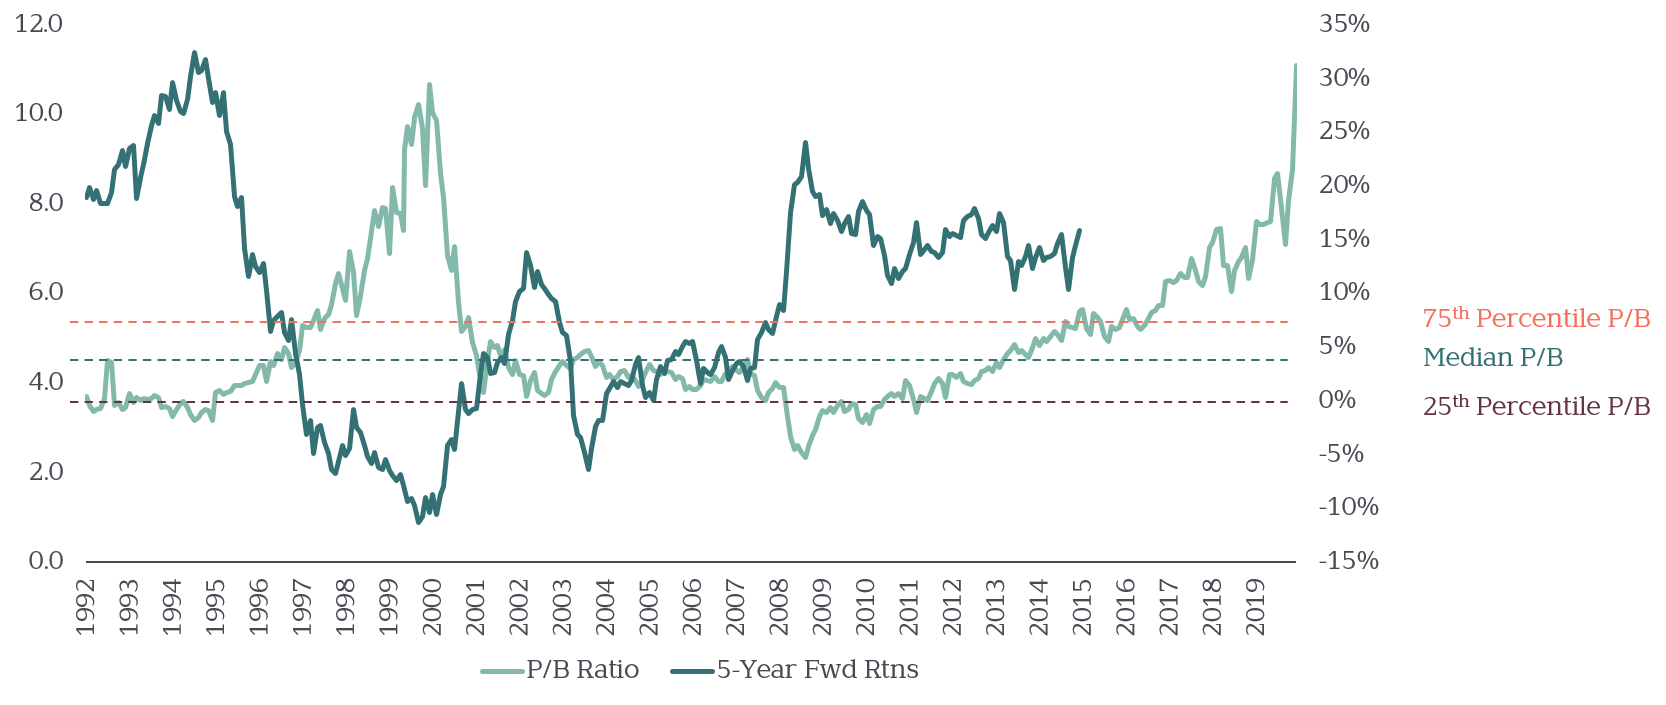
Exhibit 3: Small Value P/B Ratio and 5-Year Returns
June 1992—June 2020
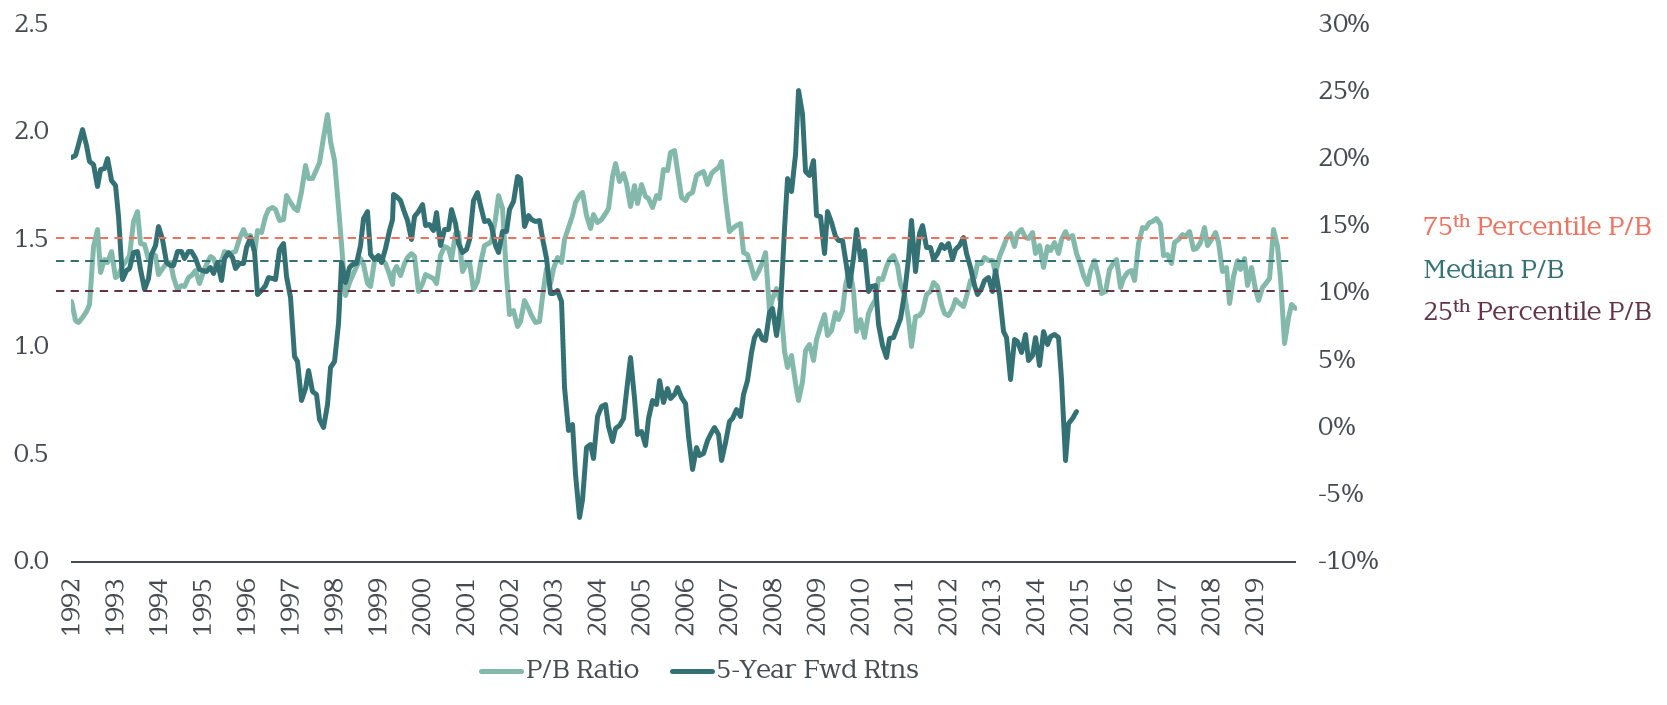
When growth/value valuations were relatively high or low, what happened to their respective returns over the next five years? Our charts reveal a relatively consistent, repetitive pattern: While not a precise timing indicator, higher valuations typically precede lower returns. Lower valuations often precede higher returns.
Poised to Pounce?
Large growth company valuations are higher than they’ve typically been historically. A lot higher. As usual, you’ll find pundits suggesting, “this time is different.” But based on the exhibits above, we would suggest being skeptical that such high prices will persist (large growth), and optimistic over what’s recently done more poorly (small value).
This is in no way to suggest we’re tactically adjusting portfolios. Instead, we use disciplined portfolio rebalancing to pare back (but not abandon entirely) what’s overweight, and add to what’s underweight. Absent a need to rebalance, we can also pare back on large growth stocks when it’s time to create cash flow.
Is this time truly different? While anything is possible, we prefer to continue investing based on what’s most probable: low-priced value stocks have long been a stronger source for premium returns than their growth stock peers precisely because low relative starting valuations have historically led to higher subsequent returns.
And when downtrodden asset classes do bounce back, it’s usually with surprising swiftness, and little warning. As such, the best way to capture their expected higher returns is to be invested in them all along—especially when their future returns seem so out of sight.