Nearly 25 years have passed since the research of Professors Eugene Fama and Ken French helped answer one of the most important investment questions ever to face investors: “What explains the differences in stock returns?”
Prior to Fama and French’s 1992 paper, The Cross-Section of Expected Stock Returns, it was long believed returns were best explained by a stock’s sensitivity to the market, known as beta. Bill Sharpe won a Nobel Prize in 1990 in part for his capital asset pricing model (CAPM), which linked a stock’s expected return with its beta. Stocks with betas above 1.0 were thought to offer returns higher than the market, while betas under 1.0 implied below-market results.
Fama and French, however, highlighted several violations of the singular link between market beta and returns. Studying stock returns from 1963-1990, the researchers found small cap and low-priced stocks had significantly higher returns, in both U.S. and international markets, than predicted by their market betas alone. By adding size and value to Sharpe’s
CAPM, Fama and French could explain nearly all the performance difference of stocks and portfolios over time.
Importantly for investors, Fama and French’s conclusions provided a framework to construct better portfolios. Want higher expected returns? Simple—increase your portfolio’s exposure to small cap and value stocks.
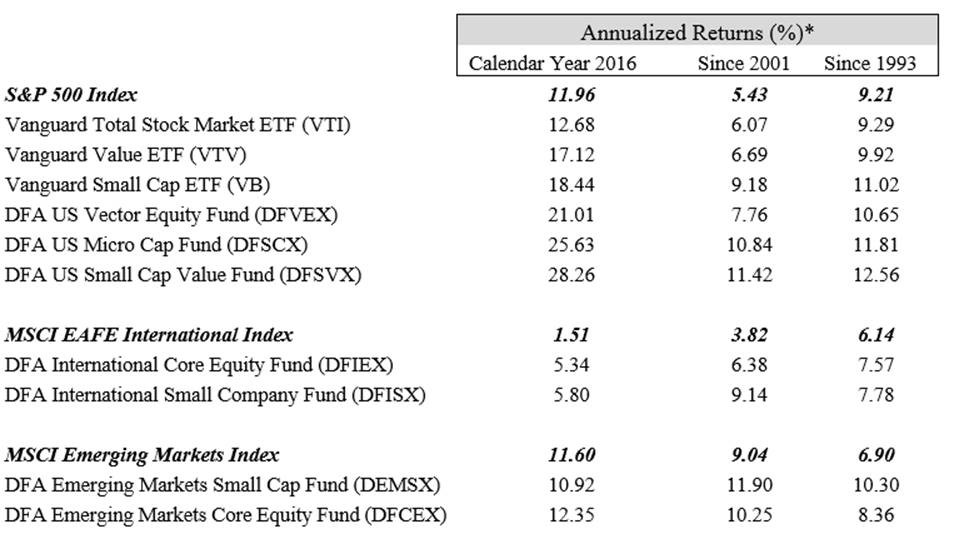
But would their theory of expected returns translate into realized returns? We now have nearly twenty-five years of data to help answer that question:

The table above shows annualized returns for the small cap and value strategies we favor in client portfolios. The data is presented to reflect how these funds performed in calendar year 2016—a great year for small cap and value stocks around the world—as well as during two longer time periods: since 2001, the year Vista opened its doors, and since 1993, the year after Fama and French published their research.
These results confirm what Fama and French proposed back in 1992—investors were likely, but not guaranteed, to earn higher returns by favoring small cap and value stocks. While returns for the entire period have been impressive, it must be acknowledged that owning a portfolio which does not move in lock step with “the market” can at times be discouraging.
Consider the six years ending in 2000: small cap stocks underperformed the popular S&P 500 by 12% per year! And from 2007-2015, growth stocks in the U.S. outpaced low-priced value stocks by an average of 4% per year. Such long stretches of underperformance can test the resolve of even the steeliest of investors.
They also serve as a great reminder that building a better portfolio may be simple in theory, but capturing those higher expected returns sure isn’t easy.

