
If we declared September 30th the end of 2016, the return of a typical Vista portfolio (65% stocks, 35% bonds) would be close to its long-term average of 8.8%. An average year may not sound like news until you realize how rarely it has occurred historically.
The graph below shows net returns for a 65/35 portfolio since 1926. The green vertical bars represent returns each year while the grey horizontal bar represents the historical average, plus or minus one percent.
65% Stock / 35% Bond Portfolio
Net Returns* 1926—2015 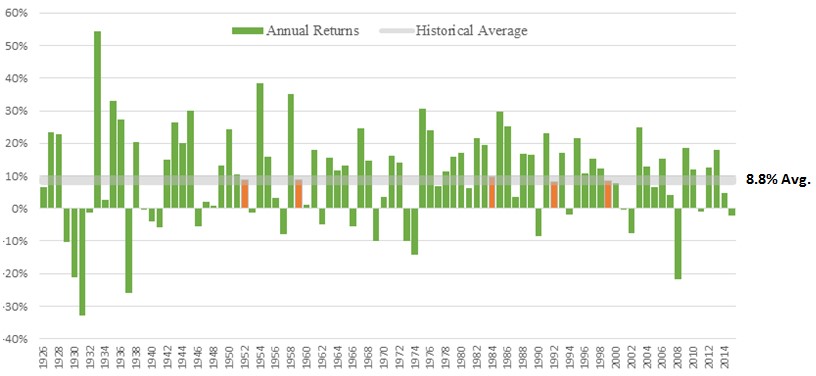
Source: Dimensional Fund Advisors. *Net returns assume management fee of 0.95%.
Over the past ninety years, the annual return has only been within one percent of the average five times (highlighted in orange in the graph above). As this picture shows, the year-to-year experience can feel more “mean” than “average” (a little math humor).
Even a diversified investor must accept that volatility is part of investing. Enduring dramatic annual performance swings, without altering course, is precisely what is required in order to earn the markets’ average return.
The temptation to react (buying high, selling low) is powerful, which is why studies routinely show 80% of investors underperform the market over time. Ironically, investors who remain disciplined are assured returns which are average compared to the market, but above-average compared to their peers.