
Including the current shutdown, there have been 18 government closures since 1976. The debt ceiling has been raised virtually every year back to 1939, and in some instances multiple times per year. So, what’s the distinction between the two and how are they related?
Government shutdowns and debt ceiling concerns really aren’t related other than by a coincidence of timing. When a shutdown occurs, the government lacks the legal authority to spend money on non-essential services. This is the result of the Anti-Deficiency Act which was passed in the 1980s. The intent was to prevent the government from spending money it didn’t have. Prior to that, the government always continued to spend under the assumption that matters would eventually get resolved by congress, meanwhile the general public was largely unaware.
In contrast, during a debt crisis (or debt ceiling) the government has bills to pay, yet lacks the legal authority to borrow to pay those bills. The government’s current authority to borrow new money ends October 17th if a “continuing resolution” or CR is not reached. The Republican-controlled House passed a spending bill which included a policy change—stripping funding for the Affordable Care Act. The Democrat-controlled Senate insisted on a “clean” CR, which means a resolution without policy changes. Short on compromise, the debate between the two sides ultimately triggered the shutdown.
In the event we do hit the debt ceiling, existing debt (think: U.S. Treasury bonds) would not necessarily go into default. Government revenue still far outpaces the amount needed for interest payments. So, while painful decisions would have to be made about which U.S. obligations have priority, the Treasury would likely prioritize debt service, Social Security and Medicare, and certain defense payments over other types of spending. Contrary to some media reports, a technical “default” does not mean the government will literally “shut down.”
A prolonged shutdown would almost certainly negatively affect the economy, but doesn’t necessarily mean stock and bond markets will plummet. In fact, the average daily return for the stock market during all government shutdowns has been +0.03%. The average daily return (for all days) since 1976 was +0.03% — the exact same![1]
The longest government shutdown on record lasted 21 days and occurred at the end of 1995. During that three week stretch, the stock market dropped 3.7%. The month after the shutdown ended, the market surged 10.5%.[2] And it appears this post-shutdown performance is no anomaly.
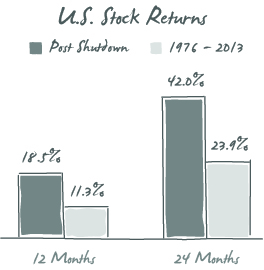
The graph above shows the average return of the U.S. stock market for the 12-month and 24-month periods immediately following a government shutdown compared to the average 12-month and 24-month returns for all periods since 1976.
It may come as a surprise to casual observers that nearly every government shutdown in history has been followed by dramatically outsized returns.
Will the trend continue? Only time will tell.
In the meantime, we believe the best protection against uncertainty are the time tested principles of asset allocation, diversification and discipline.
________________________________________
1 Patton, Mike. “Stocks and Government Shutdowns: An Historical View.” Forbes.com. October 4, 2013.
2 Korte, Gregory. “66 questions and answers about the government shutdown.” USA Today. October 1, 2013.